「ジオラマカメラ」の画像加工の勉強にあたり「ヒストグラム」を表示したいと考えています。
じゃあ、Android端末でどうやってグラフを表示するかまとめてみました。
1.ライブラリのダウンロード
今回利用するライブラリは「AFreeChart」です。
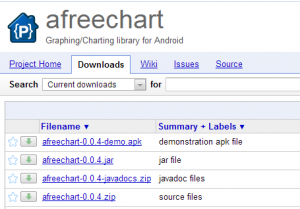
以下よりダウンロードします。
https://code.google.com/p/afreechart/
Downloadページから「afreechart-0.0.4.jar」をダウンロードしました。
2.Androidプロジェクトへのライブラリ追加
1) プロジェクトへ「lib」フォルダを作成
2) 作成したlibフォルダへ「afreechart-0.0.4.jar」ファイルを配置

3) 追加したファイルを右クリックして、「ビルド・パス」-「ビルド・パスに追加」を選択
![]()
4) 「参照ライブラリー」へ「afreechart-0.0.4.jar」が追加される。
【補足】本来はこれで問題ないのですが、この状態だと実行時に以下のエラーが発生します。
「Caused by: java.lang.NoClassDefFoundError: org.afree.graphics.geom.RectShape」
ライブラリがエクスポート設定されていないのが原因です。
5) ライブラリのエクスポート設定
ビルド・パスの構成画面から「順序およびエクスポート」タブを表示します。
表示されている「afreechart-0.0.4.jar」のチェックをONにします。
設定完了後にリビルドすることでライブラリがエクスポートされるようになります。

3.Viewクラスの作成
グラフ表示するためのViewクラスを作成します。
public class GraphView extends View {

    private AFreeChart chart;
    private RectShape chartArea;

    public GraphView(Context context, AttributeSet attrs) {
        super(context, attrs);
        chartArea = new RectShape();    // (1)
    }

    @Override
    protected void onSizeChanged(int w, int h, int oldw, int oldh) {
        super.onSizeChanged(w, h, oldw, oldh);
        chartArea.setWidth(w);          // (2)
        chartArea.setHeight(h/2);
    }

    @Override
    protected void onDraw(Canvas canvas) {
        super.onDraw(canvas);
        this.chart.draw(canvas, chartArea);
    }

    public void setChart(AFreeChart chart) {
        this.chart = chart;             // (3)
    }

}
(1) グラフの描画領域をインスタンス化しています。
(2) 描画サイズの調整を行っています。今回は横は画面幅に、縦は画面縦の1/2サイズに設定しています。
(3) 描画するグラフ情報を設定するためのsetterになります。
4.layoutの作成
3.で作成したViewクラスをlayoutにて設定します。
<?xml version="1.0" encoding="utf-8"?>
<LinearLayout xmlns:android="http://schemas.android.com/apk/res/android"
    android:layout_width="match_parent"
    android:layout_height="match_parent"
    android:orientation="vertical" >
    <org.example.bitmap.view.GraphView
        android:id="@+id/graph1"
        android:layout_width="match_parent"
        android:layout_height="wrap_content" />
</LinearLayout>
5.Activityの作成
これでView、layoutが準備できたので実際に画面へグラフを表示してみます。
public class GraphActivity extends Activity {
    @Override
    protected void onCreate(Bundle savedInstanceState) {
        super.onCreate(savedInstanceState);
        setContentView(R.layout.graph_layout);

        //グラフにするデータの作成(1)
        XYSeries series = new XYSeries("data", true, false);
        for (int i = 0; i < 255; i++) {
            series.add(i+1, i);
        }
        XYSeriesCollection ds = new XYSeriesCollection(series);

        //AFreeChartの作成(2)
        AFreeChart xyplot = ChartFactory.createXYBarChart(
                "XYBarサンプル",
                "Xラベル",
                true,
                "Yラベル",
                ds,
                PlotOrientation.VERTICAL,
                true,
                true,
                false);

        //Viewへグラフを設定
        GraphView charview = (GraphView) findViewById(R.id.graph1);
        charview.setChart(chart);

    }

}
(1) グラフに表示するデータを作成します。
(2) グラフのタイトルや軸名、表示データを設定します。
(3) Viewへ作成したグラフクラスを渡します。
※設定するグラフによって作成するデータ、グラフクラスが異なります。
詳しくは「http://afreechart.googlecode.com/svn/doc/javadocs/index.html」参照
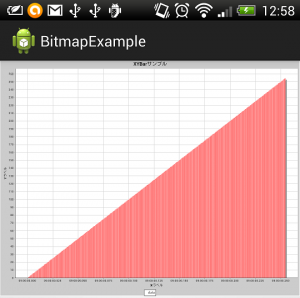
6.表示結果
ん~字が小さいしデザインもなんかExcelのグラフっぽくてかっこ悪い・・・
とりあえずグラフは表示できたのでこれでOKですね。


この記事のトラックバック用URL